Introduction
“Scientia potentia est”
A famous Latin aphorism which roughly translates to “Knowledge is Power”. In the 21st century context, we’d rephrase it to create the quote “Data is Power”. Just as petroleum is known as liquid gold, data is the digital gold of the modern era. It’s like a diamond in the rough, by itself just a worthless piece of coal. But under the right hands, with the right tools and vision, one can create priceless value.
But unfortunately, most of these potential diamonds never end up being; an independent research by Cisco has found that of the 800 Zettabytes of the data collected by IoT endpoints over 92% of it never ends up being used, just because it doesn’t reach the right hands; causing databases to become bloated with information that will never be used.
With IoT sales picking up record growth in 2021 and us finally having broken the 100 million+ shipments in Q2 2021, it’s high time we start turning this coal to diamonds, there is a thriving need among organizations to make sense of this IoT data with IoT analytics to extract important business insights that can be used as a competitive advantage and informed decision-making.
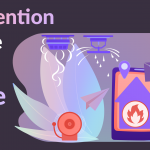
In smart buildings, energy utilization dashboards can aid in sensor control, identifying specific times to heat or cool rooms, finding air quality threats, and deploying predictive fixes and maintenance. A study by Texas Instruments indicates that in HVAC and lighting IoT solutions, energy use can be cut by 40% just by sensor control. The same study also indicates that thermal comfort improves human productivity by 3%, impacting the bottom line.
What is Industry 4.0?
The 3rd Industrial Revolution was creating automation and this automation created Data, The 4th Industrial Revolution will be about using this data to extract meaningful information from it. For example, visualizations, reports, and alerts generated with real-time IoT data of an organization or a coworking space can be directly used to provide better employee experiences which lead to better productivity, comfort, and security. Indirectly leading to better customer relationships and retention. According to Grand View Research, the global IoT analytics market size is expected to reach USD 57.3 billion by 2025 at a CAGR of 29.7%.
What better way to highlight the importance of Dashboards than to take Grafana’s example, an analytics and visualization software to monitor IT infrastructure, which was just valued at 2.2 billion dollars in April 2021, a tenfold increase from just a couple of years ago.

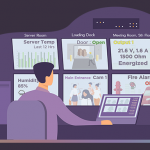
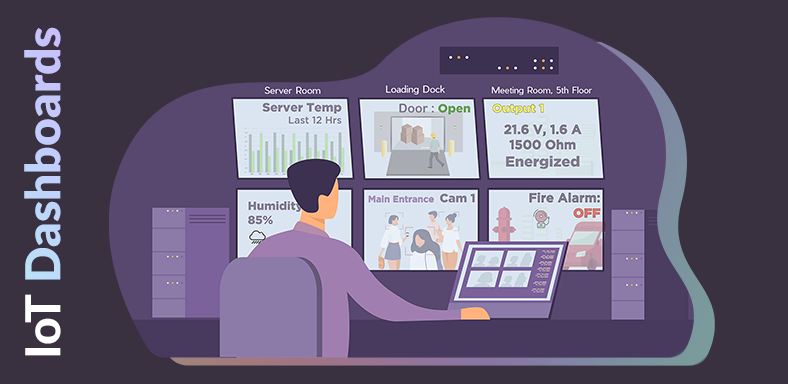
A custom IoT dashboard grants easy data distribution, straightforward data analysis, and better IoT asset control and management. What’s more, it approves businesses to make more effective real-time business decisions, exposes new growth possibilities, and finds acumens that would be hidden unless.
What’s stopping us?
So why hasn’t everyone adapted to this technology, you may be wondering? Long Story Short, the answer is: an extremely high barrier to entry and cost overheard. It’s not that there exist no IoT dashboards that are provided by a few large corporations where sensors & hardware devices are endemic only to their ecosystem. These dashboards are of no use to an integrator or an enterprise who would build an ecosystem with devices from a wide range of manufacturers and vendors.
To get around these limitations, many times businesses decide to build their own dashboards to support 3rd party API access and cloud connectivity for their hardware devices. However, these dashboards are hardcoded for that specific business process which eventually becomes redundant on hardware changes and has remained beyond reach for most manufacturers.

Building dashboards has thus been a futile effort for hardware companies for many years. They’ve been burning cash on these dashboards like crazy to develop what was eventually only a closed ecosystem.
The idea of axess.ai took its inception when we experienced firsthand how limited resources there were for people to build real-time dashboards quickly for their business use cases. There was not a single monitoring system for an entire ecosystem that remained compatible with ever-changing hardware device parameters, provided a standard interface for devices from different manufacturers, and further, could also work for integrators looking to combine the ecosystems from different organizations on a single dashboard.
From then on, we started with a vision to build a server agnostic, platform-independent, no-code, plug-n-play dashboard for cloud-connected hardware devices that can easily integrate with 3rd party web applications to build an ecosystem of integrator-defined applications specific to their business use case without any coding effort. What started as a no-code IoT dashboard solution in 2019 is now a suite of 6 independent microservices with countless use cases across various industries.